A Cheap Rain Gauge, a Month of Bucket Tips, and the Limits of a Trusted Number
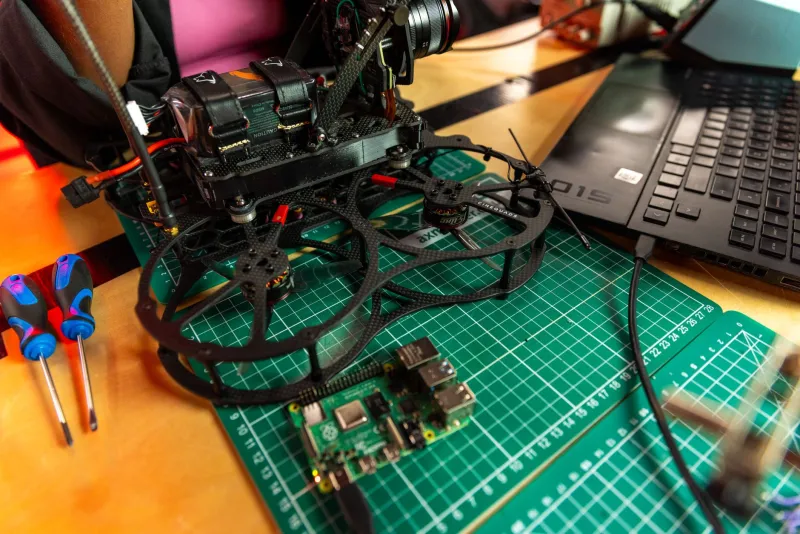
For the past month, a twenty-dollar tipping-bucket rain gauge has been bolted to a fence post in my backyard, counting every time its little seesaw dumped a spoonful of water. It reports to a Raspberry Pi, which reports to Prometheus, which reports to a Grafana dashboard that I have definitely not stared at during dinner. The project was supposed to be a simple logging exercise. It turned into a month-long argument with the National Weather Service and, eventually, with my own assumptions about what a number means.
The setup: a reed switch and a suspiciously clean counter
The gauge is the generic kind sold online with a mounting bracket and a vague instruction sheet. It claims 0.01 inch of rain per tip. A magnet on the tipping bucket closes a reed switch as the bucket pivots, and the switch is wired to a Raspberry Pi GPIO pin with the internal pull-up, a small capacitor for noise, and a 75-millisecond software debounce. Each edge increments a counter stored in SQLite. A tiny exporter writes a textfile for node_exporter, and Prometheus scrapes rain_gauge_tips_total and rain_gauge_inches_total every 15 seconds. NTP keeps the timestamps sane. The counter survives reboots because losing rain data to a kernel update felt like a very 2026 way to fail.
For the first week, the dashboard was beautiful. The line went up when it rained. The line did not go up when it did not rain. I felt like an observability professional.
Then I compared it to the nearest NWS station.
The other sensor is six miles away
The National Weather Service station is about six miles northeast of me, which in suburban terms is close enough to feel comparable and far enough to be a different weather system. I pulled hourly precipitation observations through the NWS API and built daily totals from local midnight to local midnight, allowing a one-hour offset for observation timing. The gauge and the station agreed on when it rained. They disagreed on how much.
Across 27 days with measurable rain, the gauge read low. Not catastrophically low, but stubbornly low: about 9 percent under the station on average, with heavier events losing 12 to 15 percent. On a few drizzly mornings the gauge recorded nothing while the station logged 0.02 or 0.03 inch. The correlation was high enough to be seductive, around 0.97, and that was the trap. A high correlation makes you think you have a calibration problem. Sometimes you have a geometry problem.
The funnel was doing arithmetic
I pulled the gauge apart and did the least glamorous test in data science: I dripped a known volume of water through it with a graduated cylinder and counted tips. The nominal catch diameter is 4 inches, which gives a bucket tip volume of roughly 2 milliliters for 0.01 inch of rain. My gauge tipped closer to every 2.2 milliliters, and the effective catch area looked smaller than advertised once the lip and the funnel transition were taken into account. In other words, each tip represented more rain than the firmware assumed. The instrument was not lying. It had a different definition of an inch.
There were secondary effects too: a slightly off-level mount, splash out of the funnel during heavy bursts, and the fact that a tipping bucket is a mechanical device with friction and surface tension. But the systematic undercount was mostly geometry. The twenty-dollar gauge was a physical model of a rain event, and the model was biased.
A correction model with its hands visible
I did not want to multiply by a magic number and call it science. I paired the gauge's daily totals with the station's daily totals, fit a robust linear model through the origin, and got a correction factor of about 1.10. A bootstrap over the paired days put the plausible range at 1.06 to 1.14. That range is more honest than the four decimal places Grafana was happy to display.
I also checked whether the correction varied with rain rate. It did, a little: heavy events wanted a slightly smaller factor, drizzle wanted a larger one, and the drizzle cases were exactly where the station comparison was weakest. So I kept it simple. Raw counts stay raw. A Prometheus recording rule produces a corrected series, and the dashboard shows both. The corrected number is labeled as derived, with the calibration date and method attached. If the gauge gets remounted or the funnel gets clogged, the correction is invalid and the label says so.
Calibration is a software trust problem
The uncomfortable part is that the gauge behaved like a lot of APIs I have integrated. It returned a number with no error semantics. The number looked authoritative because it arrived on time and had a unit. The dashboard made it look more authoritative by drawing a smooth line. Somewhere between the reed switch and the graph, we lost the provenance.
That is a software problem as much as a hardware one. A sensor metric needs the same skepticism as user input: validate the range, watch for stuck counters, keep the raw signal, record the transformation, and do not let a derived value masquerade as ground truth. A metric without units, a source, and a calibration date is a rumor with a timestamp.
The National Weather Service did not win the argument, by the way. Its station is six miles away and measures a different patch of sky. It was another sensor, not a referee. The rain gauge is still on the fence post. It is still cheap. But now it reports two numbers, one of which admits what it does not know, and that feels like the right kind of upgrade.