Your Living Room Is Talking Behind Your Back: A Packet-Capture Tour of the American Smart Home
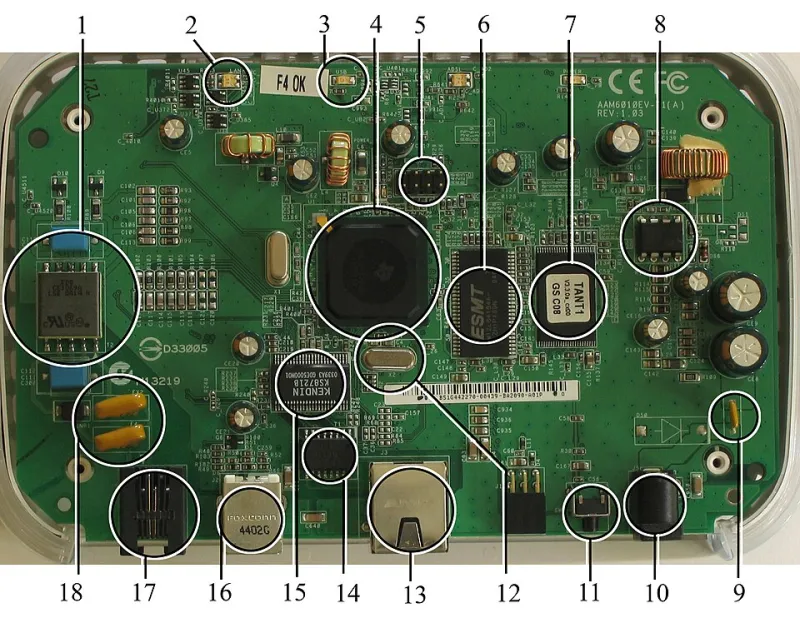
Photo: User Mike1024 on en.wikipedia, Public domain, via Wikimedia Commons
The router graph is what got me. One Tuesday I opened my mesh network's admin panel and noticed a steady baseline of outbound traffic at 3 a.m. — nobody streaming, nobody downloading, nobody awake except, apparently, my house. So I did what any engineer does when a system behaves oddly: I tapped the wire and started logging.
The Lab Setup (Your Closet Counts)
I'm not running a SOHO lab here; this is a normal suburban house with a normal amount of gadgets — a smart thermostat, a big-screen TV, a video doorbell, a fleet of brand-name light bulbs, a robot vacuum, and the usual complement of phones and laptops. The tooling was deliberately boring:
- A Raspberry Pi running Pi-hole as the primary DNS server, so every hostname lookup got logged
- A managed switch with port mirroring feeding tcpdump into pcap files on a spare SSD
- Two weeks of capture, roughly 40 GB of logs, analyzed with a Python script and a lot of
awk
Total cost beyond hardware I already owned: zero dollars and one very patient spouse.
The Phone-Home Leaderboard
Ranking devices by outbound bytes over two weeks, the results were not what I predicted:
1. The TV — 1.9 GB. Not shocking that it's first, but the composition was. Only about a third was streaming video metadata. The rest was telemetry beacons, ad-tech endpoints, and a persistent connection to an analytics domain that fired roughly every 90 seconds, awake or asleep. The TV was the chattiest device in the house by a factor of five.
2. The robot vacuum — 340 MB. I want you to sit with that number. My vacuum uploaded more data than my work laptop. Digging into the pcaps, most of it was the floor map — my house's floor plan, compressed and shipped to a cloud service several times a day, plus firmware check-ins and what looked like usage telemetry.
3. The thermostat — 120 MB, but the strangest DNS pattern. It contacted eleven distinct third-party domains that had nothing to do with heating or cooling. Two were ad measurement networks. A thermostat does not need to know about ad measurement.
4. The light bulbs — tiny volume, maximum creepiness. Each bulb checked in with the vendor's cloud every few minutes. Low bandwidth, but the frequency meant my DNS logs were essentially a presence-detection system: bulbs in the bedroom stop checking in when we're asleep downstairs.
What You Can Actually Do About It
The good news: you don't have to go full Amish. A weekend of firewall work tamed most of it.
Block by domain at DNS. Pi-hole made this trivial. Blocking the TV's analytics domains cut its outbound traffic by about 70% with no visible loss of function. Streaming still worked; the ads just got quieter.
VLAN the things. I already had VLAN-capable gear, so all IoT devices went onto a segregated network with no route to my laptops or NAS. If a light bulb gets owned, the blast radius is now other light bulbs. This is the single highest-value change and takes an afternoon.
Self-host where it's cheap. The thermostat was the one device where a swap made sense — I replaced it with a local-first model that exposes a simple API and never leaves the house. The vacuum is harder; the floor-map feature is cloud-bound by design, so for now it lives on the restricted VLAN with its telemetry domains blocked, and I've accepted the tradeoff in writing, which is half the battle.
Set an alert on the baseline. The original 3 a.m. traffic turned out to be firmware checks, which is boring — but the reason I found it was that I'd never looked. A simple nightly summary of top talkers from your DNS logs turns "is my house normal?" into a five-minute weekly review.
The Takeaway
Nothing I found was a headline-grabbing scandal. It was something more mundane and more useful: a steady, invisible tax of ambient data collection, payable by every device with a Wi-Fi chip and a marketing department. You can't opt out of having a smart home behave this way — but you can absolutely watch it, rank it, and firewall the worst offenders before breakfast. The router graph looks a lot less alarming when you're the one reading it.